
Fewer than one company in five tracks well-defined KPIs for its AI implementations - even though, according to McKinsey, measuring results turned out to be the practice with the biggest impact on the bottom line (McKinsey, “The State of AI,” 2025). Companies buy licenses, organize training, and half a year later do not know whether the investment made sense.
WeAreFuture is a Polish AI consulting and implementation firm from Warsaw. Our case study of Claude adoption in a manufacturing company gives concrete numbers: 85% active users, 44% of people with their own project or skill, savings of about PLN 47k per month (survey estimate) in a group of 24 people who were able to estimate them. We measured these numbers with a set of AI adoption metrics that we designed before the program started, not after the fact.
In this article we show how to build such a set of metrics: what to measure every week, what once a quarter, how to present the results to the board and what to do when the metrics start to fall. The framework came out of the adoption programs we run in Polish companies. It works for Claude, but also for ChatGPT, Copilot or Gemini - only the sources of technical data change.
Rolling out AI and not sure it works? We will design a set of metrics for your scale and industry. See how we run AI adoption programs.
Why most companies measure AI adoption wrong
More than 80% of companies do not see a measurable impact of generative AI on the bottom line at the level of the whole organization - despite high investment (McKinsey, 2025). This is confirmed by a study from the other side: 56% of CEOs report no significant financial benefits from AI, and only 12% see both a cost effect and a revenue effect (PwC, Global CEO Survey 2026).
In our experience the problem rarely lies in the tool itself - much more often what fails is what happens with the tool after it is bought. Below are three metrics that look good in a report but say nothing about adoption.
Mistake 1: training completion rate
“70% of employees completed the training” is a metric that is easy to report but says nothing about the adoption of AI, or of a specific tool, in the organization. A certificate from an e-learning platform shows that knowledge was gained, not always that skill was. Completing a course alone does not change habits - we described this in the case study as one of the five pitfalls of adoption programs.
This metric makes sense, but as a directional signal: are employees going where we planned, is interest in the topic of AI growing, is the communication working.
Mistake 2: measuring attendance at workshops and webinars
Attendance measures interest, not a change in behavior. People come to meetings out of curiosity, out of obligation, for a break from daily tasks. None of these motivations means they will open Claude the next day on their own task. Attendance is a supporting signal - in our framework it returns as one of the program’s lead measures, but not as a measure of the tool’s adoption success.
Analysis of sentiment and engagement during meetings is another matter. That is why we design short (1-1.5 h), engaging formats: cross-department Q&A, workshops focused on one functionality, AI Office Hours. In each of them the participants do the work, not external facilitators. A large number of questions, building a PoC, a growing list of ideas for further automations - these are harder to put in numbers, but easy to notice during the sessions. Such signals tell you more about the direction of adoption than an attendance list.
Mistake 3: measuring satisfaction without measuring activity
“Employees are happy with Claude” at 8% active use is not a success, it is a symptom of a problem. High satisfaction with low activity usually means the survey was filled in by enthusiasts, and the rest of the organization has no opinion because it does not use the tool. We do measure satisfaction, stress level and time saved, but always paired with frequency of use.
These three mistakes measure the use of educational programs, not the adoption of a tool. Adoption is a change in behavior, and that is how it has to be analyzed.
Lead and lag measures - two categories of AI adoption metrics
The framework we use in adoption programs rests on one distinction:
Lead measures are leading indicators - actions you can influence this week. User activity, attendance, new use cases. If they fall, the business result will fall in a few weeks.
Lag measures are lagging indicators - business results visible after 30, 60, 90 days. Adoption rate, time saved, value in PLN. You influence them indirectly, through the lead measures that precede them.
We measure lead measures every week and work on them, correcting current actions. We measure lag measures every month, assess trends over a horizon of quarters - and these are what we report to the board.
Metric | Type | Measurement cadence | Our result after 6 months |
|---|---|---|---|
Weekly active users (+ DAU/MAU) | lead | weekly | 85% |
Depth of use (project, skill, automation) | lead | weekly | 44% |
Attendance in the adoption program | lead | weekly | above 75% |
New use cases and license requests | lead | weekly | rising trend |
Organic knowledge sharing | lead | weekly | 74% |
Adoption rate | lag | monthly | 85% |
Share of people with their own tool | lag | quarterly | 44% |
Time saved and its value | lag | quarterly | 5.7 h per week per person |
Impact on quality of work | lag | quarterly | pace 90%, quality 77% |
Cost per active user | lag | monthly | depends on the adoption level |
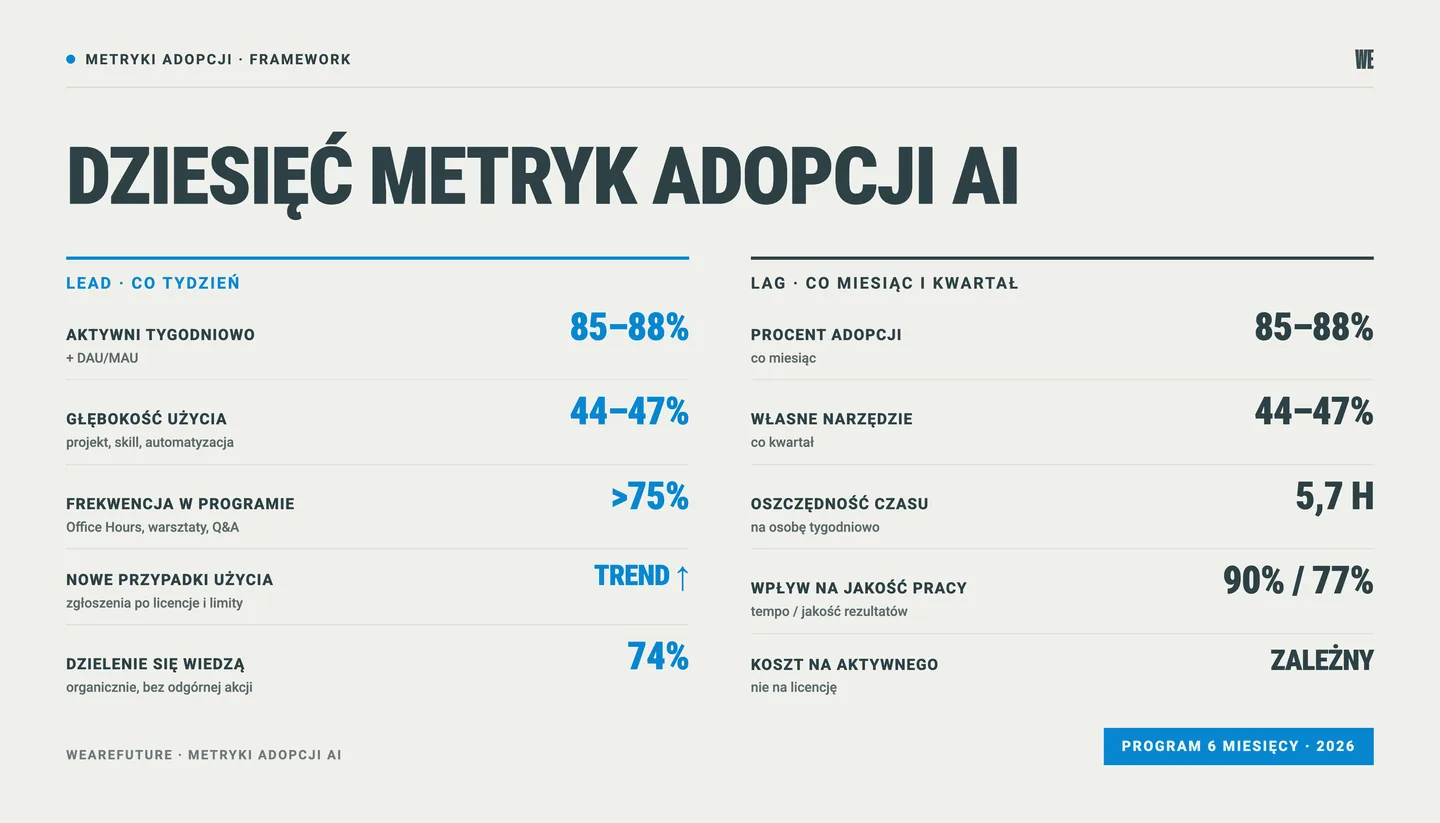
Ten AI adoption metrics with results after six months of the program in a Polish manufacturing company.
The vendor itself confirms this. In its guide to scaling Claude across an organization, Anthropic names the number of skills built independently by champions as the main leading indicator of readiness to scale - not the number of logins and not the number of people trained (Anthropic, “Deploying Claude Across Your Organization,” 2026). What counts is use measured by how many tools people have built and shared with others.
Baseline - the reference point before launch
Before the program starts, measure the starting point. How many hours a week the key, repetitive tasks take. What the response time to a customer inquiry is. What the level of satisfaction and stress is in individual teams. Which tasks are done manually and where teams use ready-made tools.
The minimum is one question in the starting survey that gives a picture of even one metric to compare against. Without knowing where you start from, after half a year you will be left with declarations that no one will find credible, because there will be nothing to compare them with. In our experience the problem is usually not AI, but the lack of a reference point from before the start. Measure the baseline before the program starts or at its very beginning.
Five lead measures - what we measure every week
Lead measure 1: weekly active users
The number of people who used the tool at least twice a week, relative to all holders of an account or license.
A deepening of this metric is the ratio of daily active users to monthly ones (DAU/MAU). High monthly activity with low daily activity means people are experimenting but not integrating the tool into daily work. A rising DAU/MAU is one of the first signals that using Claude is ceasing to be a curiosity and becoming a habit.
Lead measure 2: depth of use
The share of people who went beyond the chat window - built a project, a skill or an automation. Source: a recurring survey plus observations from workshop sessions.
This is probably the most underrated metric. A hundred people asking simple questions or writing emails with AI is a completely different scale of adoption than a hundred people, half of whom built their own tool and shared it with the team. In our program in a manufacturing company, after six months 44% of respondents had a built and working project, skill or automation of their own - delivering measurable results for whole teams, and even departments.
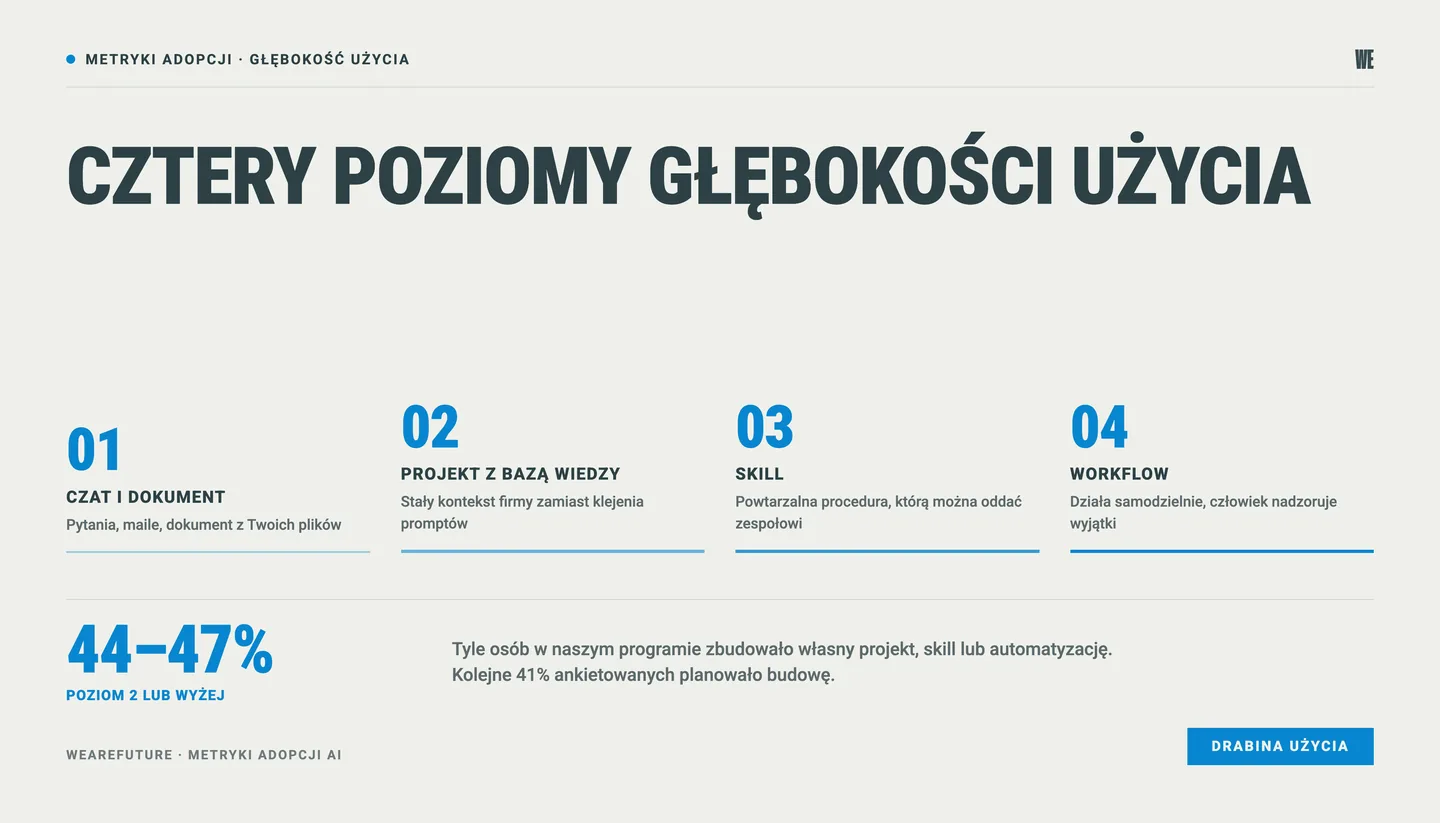
Depth of use separates a hundred people asking questions from a hundred people building their own tools.
In its adoption ladder Anthropic describes this as the move from level 1 (Claude creates a document from your files) to levels 2-3 (a repeatable skill, and then a workflow that runs on its own). What context files and AI skills in the company are and how to build them, we lay out in a separate post.
Lead measure 3: attendance in the adoption program
Presence at the program’s recurring meetings (with us: weekly AI Office Hours, workshops and Q&A sessions) and participation in the weekly challenges on the company channel. Besides attendance we look at engagement and run sentiment analysis.
Attendance on its own is not a measure of success. Its trend is what counts. In our program the optional AI Office Hours kept attendance above 75%. A drop below about 50% lasting 2-3 weeks in a row is, in our practice, a signal that the program is fading, one that comes before a drop in activity in the tool.
The causes vary: dissatisfaction with the quality of work with AI, a program that does not fit the audience, difficulty enforcing data security rules, and also plain work overload at the close of a quarter, a year or a big project.
Lead measure 4: new use cases and license requests
We look at the number and sophistication of new applications shown in 1:1 sessions or AI Office Hours, and also at requests to raise limits or buy a higher plan.
Here the trend matters much more than the exact value. It also matters how many people come back to the program leaders with problems. If employees have stopped reporting problems and ideas, that does not mean they solved all their cases themselves - most likely they stopped trying. This is an important signal of a coming drop in use. Requests for higher limits are worth comparing right away with which Claude plan makes sense at your scale.
Lead measure 5: organic knowledge sharing
We monitor the number of people who showed someone else a specific use, helped a colleague or shared a project or skill. In addition: how many people such spread reached and what happened next - whether new people use the solutions provided, or have started building their own.
In our program after six months 74% of respondents did this. This metric is practically absent from competing frameworks, and in our view it is what distinguishes an adoption program from a collection of individual users. Without a knowledge-sharing layer, adoption grows linearly. With it, it grows exponentially, because every active user becomes a channel to reach the next ones.
An additional signal: resistance and barriers - measure the trend, not the level
On top of the five metrics we add one more signal, which can be the most predictive of all: barriers reported by users. Resistance at the start of a program is almost always high, and that is normal - do not treat it as a bad result. It has to be addressed continuously and checked to see whether it declines over time. High, persistent resistance to a change that nobody communicates ends in low adoption.
How it looked for us: in the survey after a few months of the program, the most common barriers were running out of the usage limit (36% of mentions) and no time to learn (33%). We addressed the first on the license side, the second organizationally - we turned the general Office Hours into department sessions, closer to the teams’ concrete tasks.
A frequent barrier, and also a concern, is data security: what may and may not be put into AI and how to anonymize data effectively. We address this barrier with education and ongoing user support. If informal use of AI tools outside policy is already circulating in the company, it is worth starting with a diagnosis of Shadow AI and obligations under the AI Act.
Five lag measures - what we measure every month and quarter
Lag measure 1: adoption rate
The number of people using the tool daily or several times a week, measured against license holders, account holders and everyone in the organization.
In our program: 85% after six months of an active adoption program. We saw the same pattern in an adoption program for a company’s own AI tool in a pharmaceutical company, where systematic work raised adoption from limited use to regular use by most of the team.
A reasonable target range is 50-75% after 90 days of an adoption program. Remember that with a well-run program it is precisely the first 3-6 months that bring the biggest growth. In the following months the indicator will begin to flatten out - and then the task is to hold the level once reached.
Why even a well-implemented assistant cannot stand on its own without an adoption program, we show with two examples in the guide on what an AI assistant in a company will not do.
Lag measure 2: share of people with their own tool
The percentage of users who built a project, a skill, an app or an automation. This is the quarterly close of lead measure 2: weekly we look at the trend, quarterly we report the level.
Our result after six months: 44%. And a second important number: another 41% of respondents planned to build their own tool. The sum of these two groups tells you how much movement there is around AI in the organization, and the narrow group “I don’t know where to start” is a ready list of people for individual consultations and 1:1 sessions.
Lag measure 3: time saved and its value
In the basic dimension: declared hours saved per week, multiplied by the average cost of an hour of work. Our data: on average 5.7 h per week per person in the first six months - almost one full working day a week. The metric gains credibility if the processes were mapped before the adoption started.
For many people it is precisely saving time and money that is the main decision point. This indicator has to be monitored, but you cannot narrow the measurement of AI return to it. More important than how many hours we save is what value employees start to create once they have access to tools that change their work. Every organization strives for growth, and AI can speed that process up.
Lag measure 4: impact on quality of work
A regular survey asking about employees’ perceptions - a “got worse / no change / improved” scale in four or five dimensions: pace of work, burden of tedious tasks, quality of results, satisfaction, stress level.
In our case after six months: improved pace of work for 90% of people, less tedious work for 82%, higher quality of results for 77%, increased satisfaction for 51%. And a surprising result given how good the others were: stress level unchanged for most respondents. AI sped up the work, but did not take the pressure off people. This indicator has to be monitored, and people who link a rise in stress to AI should be talked to individually.
Always analyze lag measures 3 and 4 together. Time saved in isolation can be an illusion: if someone generates a report in 20 minutes instead of two hours, but then another person spends an hour correcting it, there is no saving. If the task time falls and quality rises or holds at the pre-AI level - that is a real gain. Time falls and quality falls - that is shifting work onto others, not a saving. Our data shows the first variant: 90% declare faster work and at the same time 77% better results. Only this pair of numbers is an argument.
Lag measure 5: cost per active user
The monthly cost of licenses divided by the number of active users - not by the number of all licenses. This distinction is also the simplest answer to the question “does adoption work at all.”
At 50% adoption the company pays twice as much for every actual user. This number usually surprises the finance department and convinces decision-makers: the cheapest way to lower the cost per user is not taking licenses away, but an adoption program that turns the money spent on licenses into results.
What to do when metrics fall - four scenarios
A single weaker week is information, not a reason to change strategy. The signal is only a drop in lead measures lasting 2-3 weeks in a row. Then the diagnosis usually fits one of four patterns.
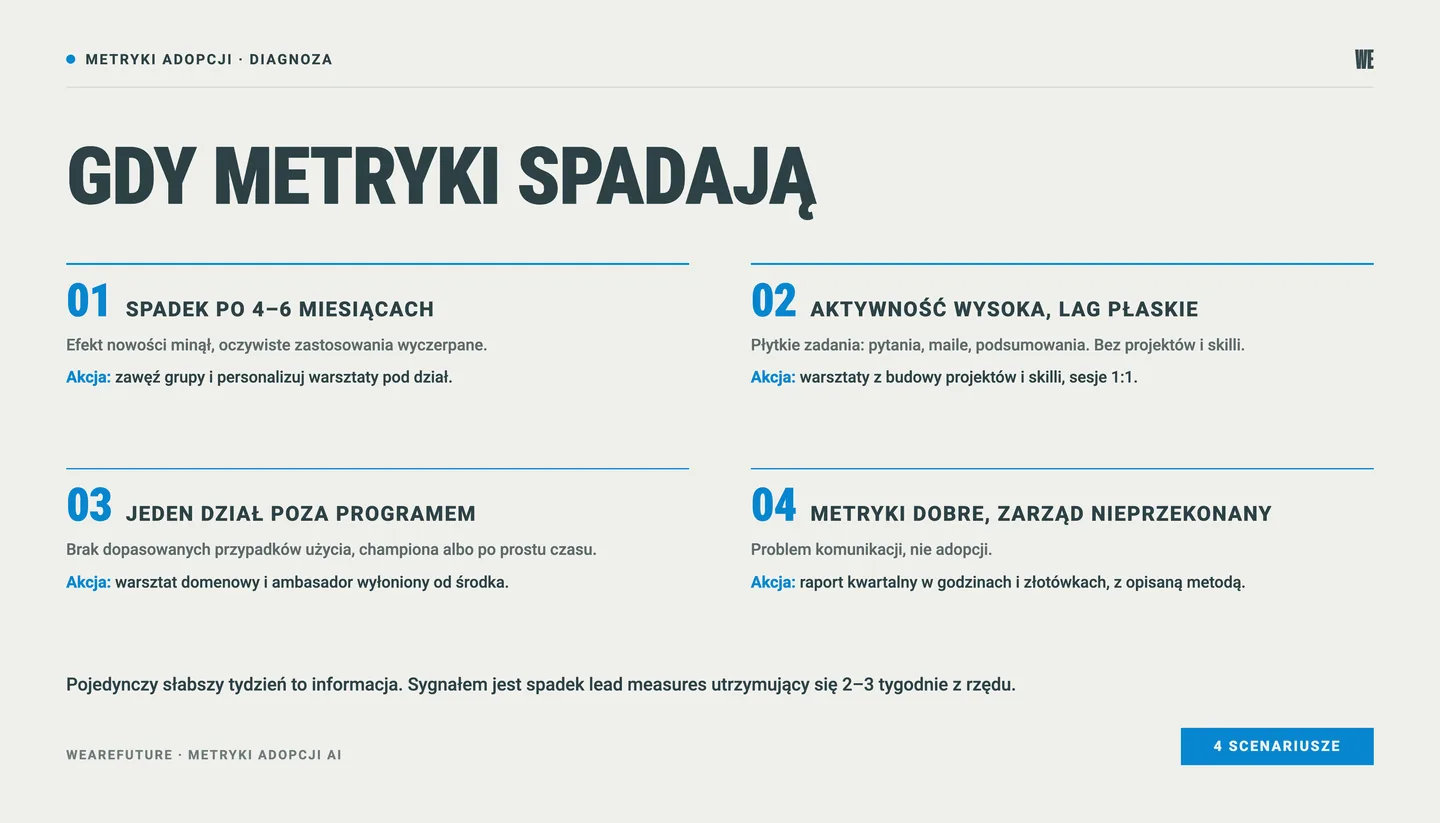
A drop in lead measures lasting 2-3 weeks usually fits one of these four patterns.
Scenario 1: adoption falls after 4-6 months. The novelty effect has passed, people have used up the obvious applications and their personal quick wins. Refresh the rhythm of the program and move closer to concrete uses: narrow the workshop groups and personalize the content. Marketing and sales - a workshop on conceptual work. Technical departments - advanced use, for example Claude Code.
Scenario 2: activity high, lag measures unchanged. People are probably using the tool for shallow tasks: quick questions, short emails, summaries. They do not get into projects, skills and automations. Act selectively: workshops on building projects and skills, and 1:1 sessions for people who need individual support.
Scenario 3: one department does not use the tool. Usually behind it is a lack of fitted use cases, no champion in the department or work overload. The answer: a domain workshop on that team’s tasks and choosing an ambassador from within. Imposing solutions from outside at this stage deepens resistance and frustration.
Scenario 4: good metrics, the board not convinced. This is most often a communication problem, not an adoption one. Go for a quarterly report with lag measures converted into hours and zlotys, with the method honestly described. Boards do not question numbers - they question numbers without a methodology.
When it is not worth building an adoption metrics system
The full framework is not for everyone. Three situations in which we advise against investing in extensive measurement.
An organization below about 30 users. The cost of measuring exceeds its value. At this scale, a count of active users from the admin panel and a regular conversation with the team are enough - the manager knows who uses it and who does not anyway.
No sponsor on the board. A dashboard that nobody reads is a waste of the time of the person who maintains it. If the board did not ask for this data, first build that demand.
A short pilot, under three months. Lag measures will not have time to appear - savings and qualitative changes need weeks of regular use. In a pilot, measure only lead measures and qualitative signals, and leave hard results for the main phase.
From the metrics of one tool to the metrics of a transformation
The framework in this article concerns the adoption of a single tool, and that is the right starting point. Without measured adoption of the first tool, every next AI initiative rests on impressions, not on data. But that is not the end of the road.
The next steps are hard “before / after” validation on selected processes (with us planned for the next phase of the program), metrics covering more tools and internal products, and governance of the whole portfolio of initiatives. How to put these elements together we describe in the guide to AI transformation in a Polish company, and how we run this work with a client is shown by our collaboration model: we build the AI Engine, a shared company context for people and agents, in stages, process by process, and every stage ends with an assessment of the effect and a decision on the next one.
Rolling out Claude or another AI tool and need a metrics framework for your scale and industry? Let’s talk about the dashboard, indicators and alert thresholds - 30 minutes, no obligation. Book a call.
Frequently asked questions about AI adoption metrics
How often should you measure AI adoption in a company?
Lead measures (active users, attendance, new use cases) - every week, because you can react to them right away. Lag measures (adoption rate, savings, impact on quality) - with a survey about every three months and a quarterly report for the board. More frequent surveying tires people and spoils the quality of answers.
Is the Claude Team or Enterprise admin panel enough to measure adoption?
No. The panel gives hard data on activity - number of users, frequency, DAU/MAU - but it will not tell you how many hours people save, what blocks them or whether they share knowledge. You need three sources: the panel, a recurring survey and qualitative signals from sessions. None of them alone gives the full picture.
What AI adoption rate is good after 90 days?
From our practice: 50-75% active users after 90 days, with an active adoption program (weekly sessions, challenges, 1:1 support) and a mandate from the board. Without a program the typical result is 30%, at most 50%, reached most often only after a year. Treat any result above 80% in the first half year as very good.
How do you convert time saved with AI into zlotys?
Hours saved per week times the cost of an hour of work, times the number of people. In our project: on average 5.7 h per week per person, at a rate of PLN 80/h about PLN 47k per month (survey estimate) from a group of 24 people. Always state the sample, the method and the rate - a report without a methodology loses credibility.
What to do when the board does not believe the results despite good adoption metrics?
This is most often a communication problem, not a data one. Three moves: convert lag measures into zlotys, openly describe the method (what is a declaration and what is a hard measurement), show one story of a specific process before and after. One validated story plus an honest number convinces faster than ten indicators.
Does the adoption metrics framework also work for ChatGPT, Copilot and Gemini?
Yes, the framework is independent of the tool. Lead and lag measures, user segmentation, baseline and alert thresholds work identically for any AI assistant. The power / habitual / novice / non-user segmentation itself, incidentally, comes from the Microsoft 365 Copilot adoption dashboard. Only the sources of technical data change - every vendor has its own admin panel.
Sources
McKinsey (2025), The state of AI: How organizations are rewiring to capture value - fewer than one company in five tracks well-defined KPIs for gen AI solutions; more than 80% of respondents do not see an impact of gen AI on EBIT at the organization level.
PwC (2026), 29th Annual Global CEO Survey - 56% of CEOs see no significant financial benefits from AI, 12% report both a cost and a revenue effect.
Anthropic (2026), Deploying Claude Across Your Organization - the adoption ladder and the number of skills built by champions as a leading indicator of scaling.
Microsoft Learn, Microsoft 365 Copilot adoption dashboard (Viva Insights) - user segmentation power / habitual / novice / non-user.
Data from the WeAreFuture adoption program in a Polish manufacturing company, survey after six months: 85% active users, 44% of people with their own project or skill, 74% sharing knowledge, 5.7 h saved per week per person (WeAreFuture, 2026).
See also: Claude AI adoption in a Polish manufacturing company - case study (2026), the full story of the program the numbers in this article come from. And AI training for business - the complete guide (2026): where to start, which programs to choose, when it is not worth it.
